Fix the steps where people leave
A conversion rate can't say why visits end without an order. Forge Mark shows the step where most people leave and names the likely cause.
Where visits stall between the product page and checkout, with the likely cause.
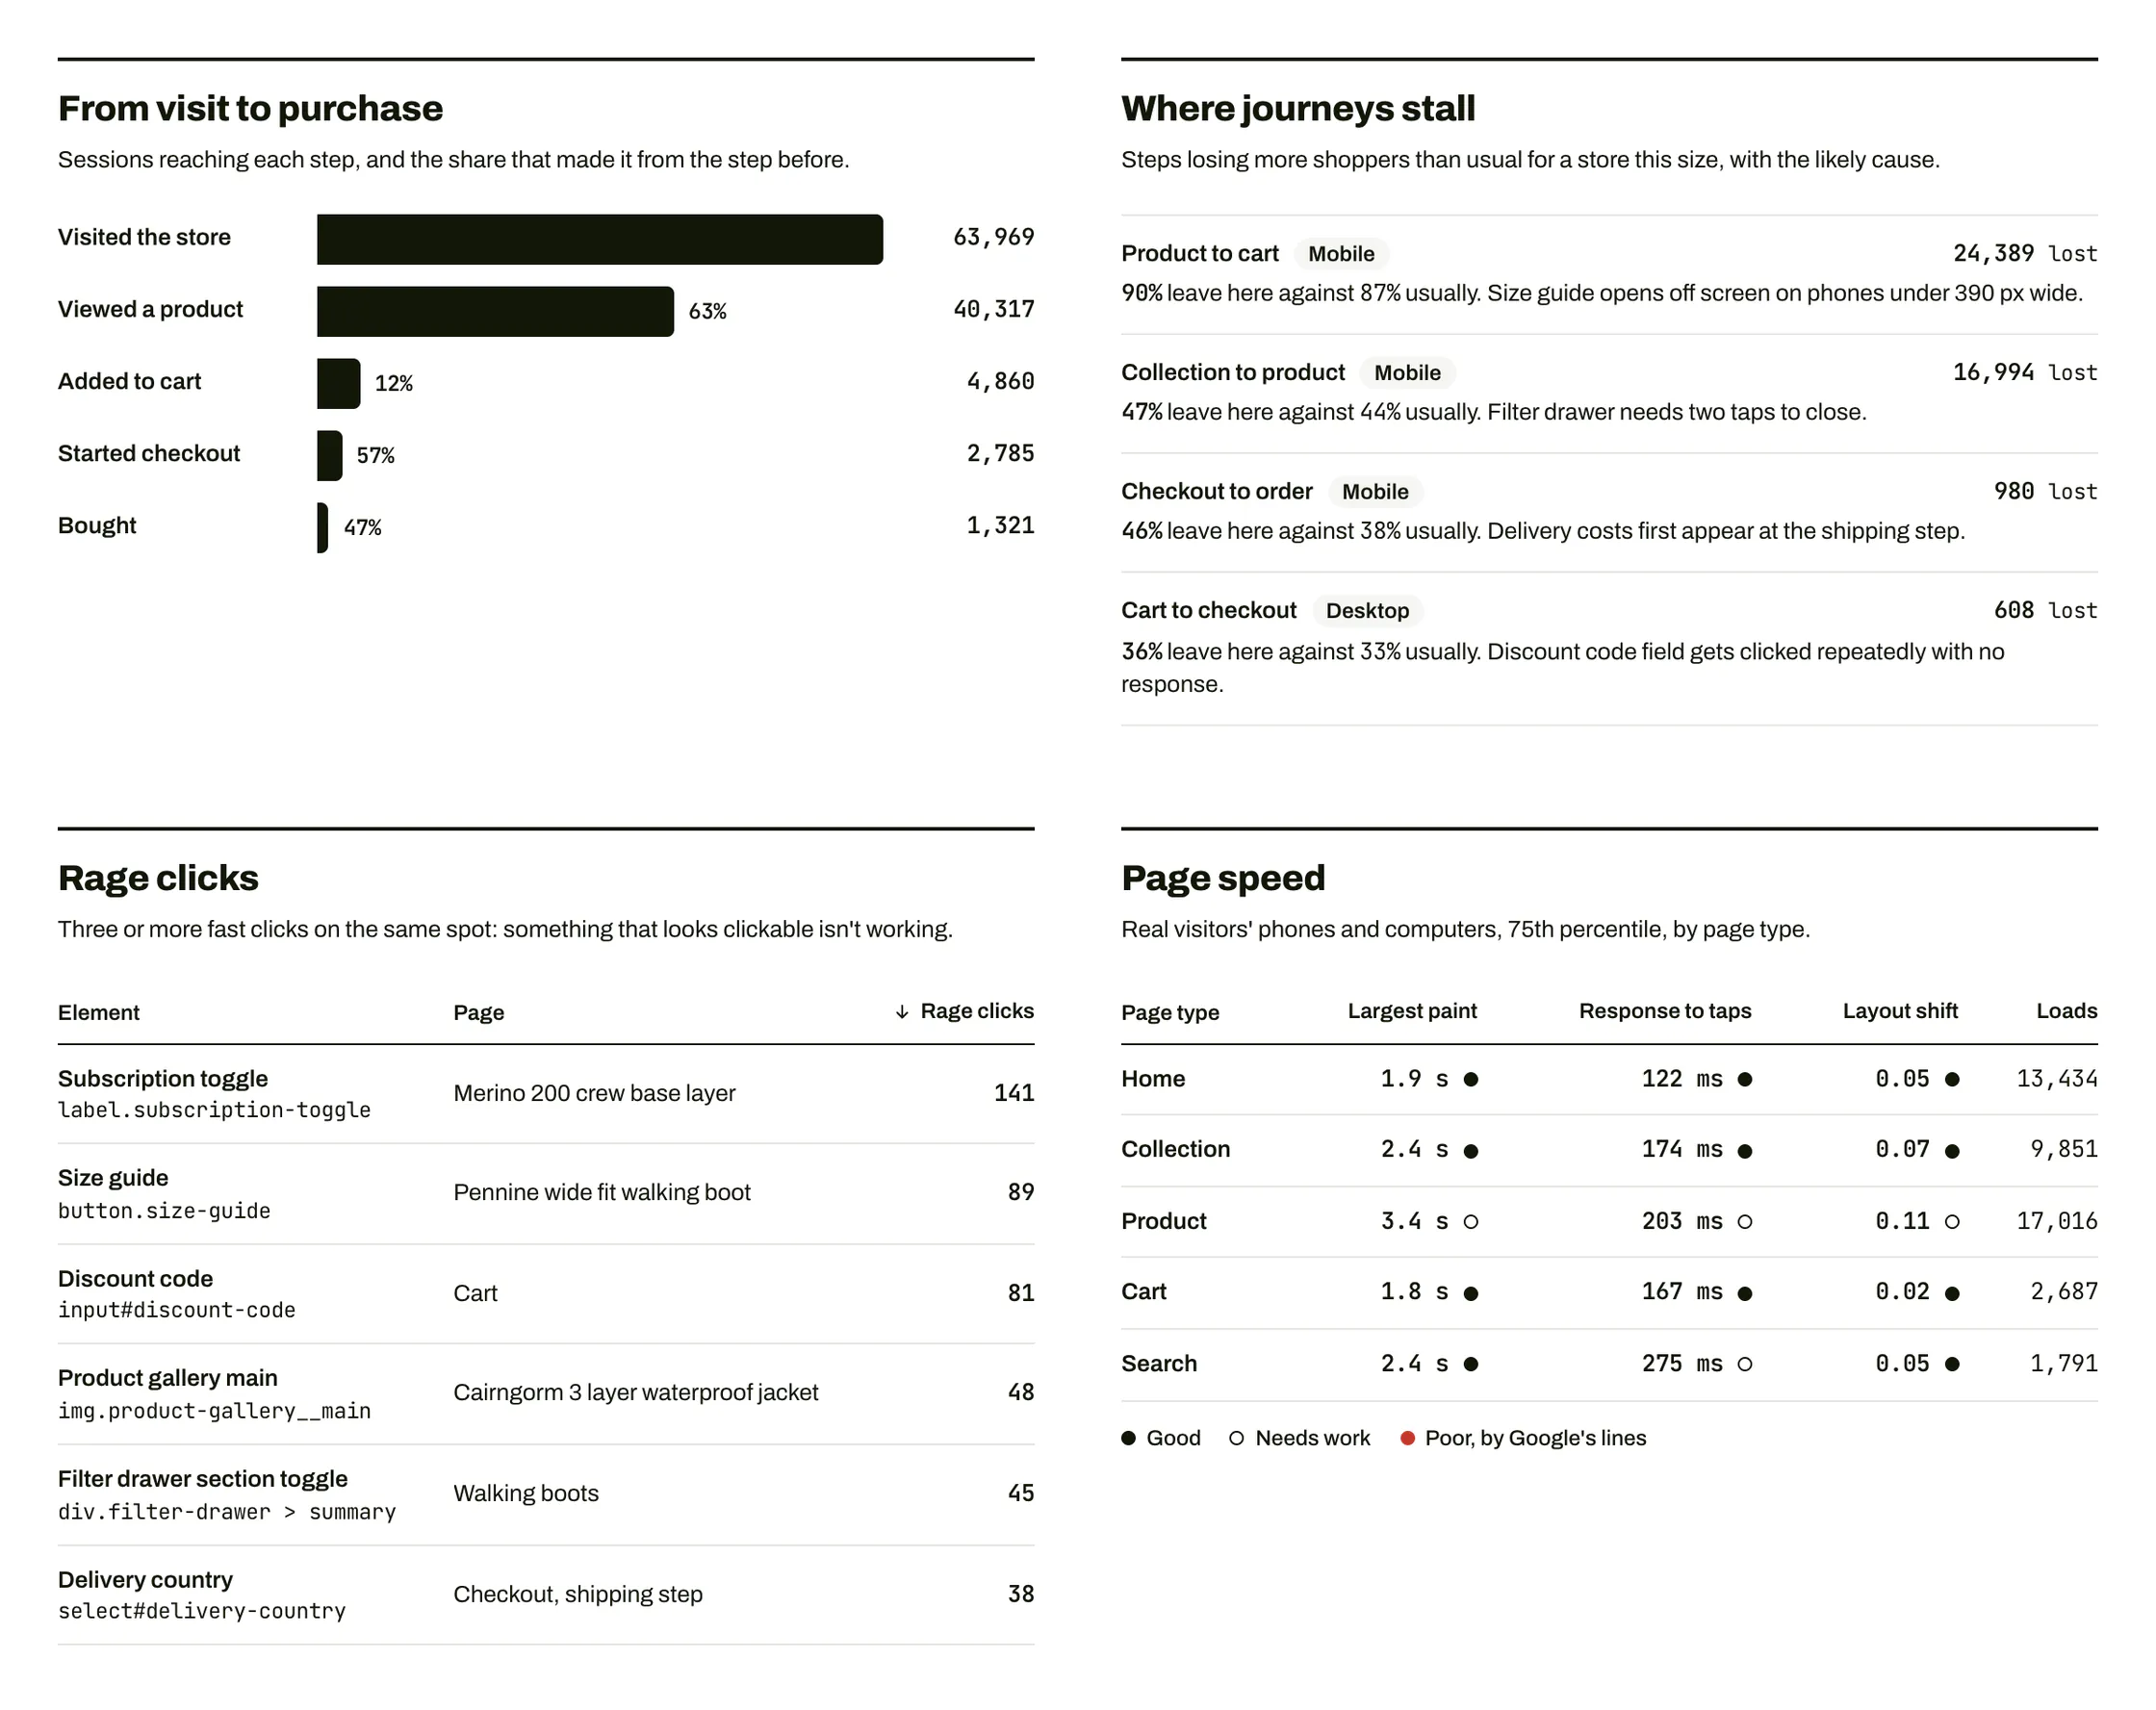
See where journeys stall, by device
Visit, product, basket, checkout, order.
Each step shows how many reached it and how many left there. Tap a step for the likely cause: rage clicks on an element, a slow page, a form that fails.
Visits and sales from AI assistants are counted too.
Explore shoppersFrom visit to purchase, 28 days
-
Visit48,200
17,800 left, 37%
-
Product page30,400
26,140 left, 86%The biggest share leaves here
-
Basket4,260
1,790 left, 42%
-
Checkout2,470
1,290 left, 52%
-
Purchase1,180
2.4% of visits bought
Product page, on phones
Rage clicks: size selector612 visits
Page speed, real visitors
LCP2.1 s
Good
CLS0.04
Good
INP310 ms
Needs work

Fix the field, not the whole page
Every form, field by field.
Forge Mark counts each field people reach and each one they quit on. Checkout steps from contact details to payment show the same way.
A broken step shows before it costs a week of sales.
Explore the pixelQuote requestLarchmere Kitchens, last 28 days
-
Started the form
112 -
Name1125%
-
Email1068%
-
Phone9716%
-
BudgetBudget: 31% leave here 8131%
-
Message567%
-
Sent
52enquiries
Reads field names only, never what anyone types

Every fix ranked, surest first
A value range in sales a month, the evidence and how sure we are.
Every screen feeds one list. Make the change yourself, apply it in the app, or send it to Forge as a costed job.
Once it ships, Impact measures it over 28 days before and after.
Explore impactRecommendationsNorthfield Supply Co., surest first
£8,700 to £21,000 a month across eight fixes
-
- 38%
- leave at the delivery step
- 1,240
- checkouts in 28 days
-
- 4.1 s
- to show a product page on a phone
- 1.2%
- of phone visits buy, 2.9% on desktop
-
- £2,140
- spent in 28 days
- 0
- new customers from them
-
- +£4,100
- most likely, a month
- 26
- weeks of spend and sales read
-
- 2,900
- searches a month
- +410
- visits a month at 3rd
-
- 0 of 5
- assistants name you
- 3
- rivals named instead
-
- 22%
- buy again by day 90
- £68
- average second order
-
- 312
- rage taps on ‘Size’
- 18
- product pages
- 4
- signals: rage clicks, speed, forms and errors
- 28
- days before and after every fix you ship
- 7 KB
- gzipped, the tag for sites that aren't on Shopify
- £0
- a month
Frequently asked questions
What does the pixel record?
Behaviour, on analytics consent: where people go, scroll, tap and stall. A guest's email is hashed on your own site, so Forge never receives it. No IP addresses are stored, and there's no fingerprinting.
How do I know a fix is right?
Each one shows its sample size and how sure we are. After you ship it, Impact measures the change over 28 days before and after.
Do I need a developer?
For most theme changes, yes. Forge Mark never writes to your theme files. You can brief your own developer or ask Forge to quote.
Does it work on a site that isn't Shopify?
Yes. With the one-line tag or the WordPress plugin you get the same steps, rage clicks, speed and forms.
Find your first stall.
Add the app or the tag in a few minutes and see where visits stop.