The numbers that matter, on one screen
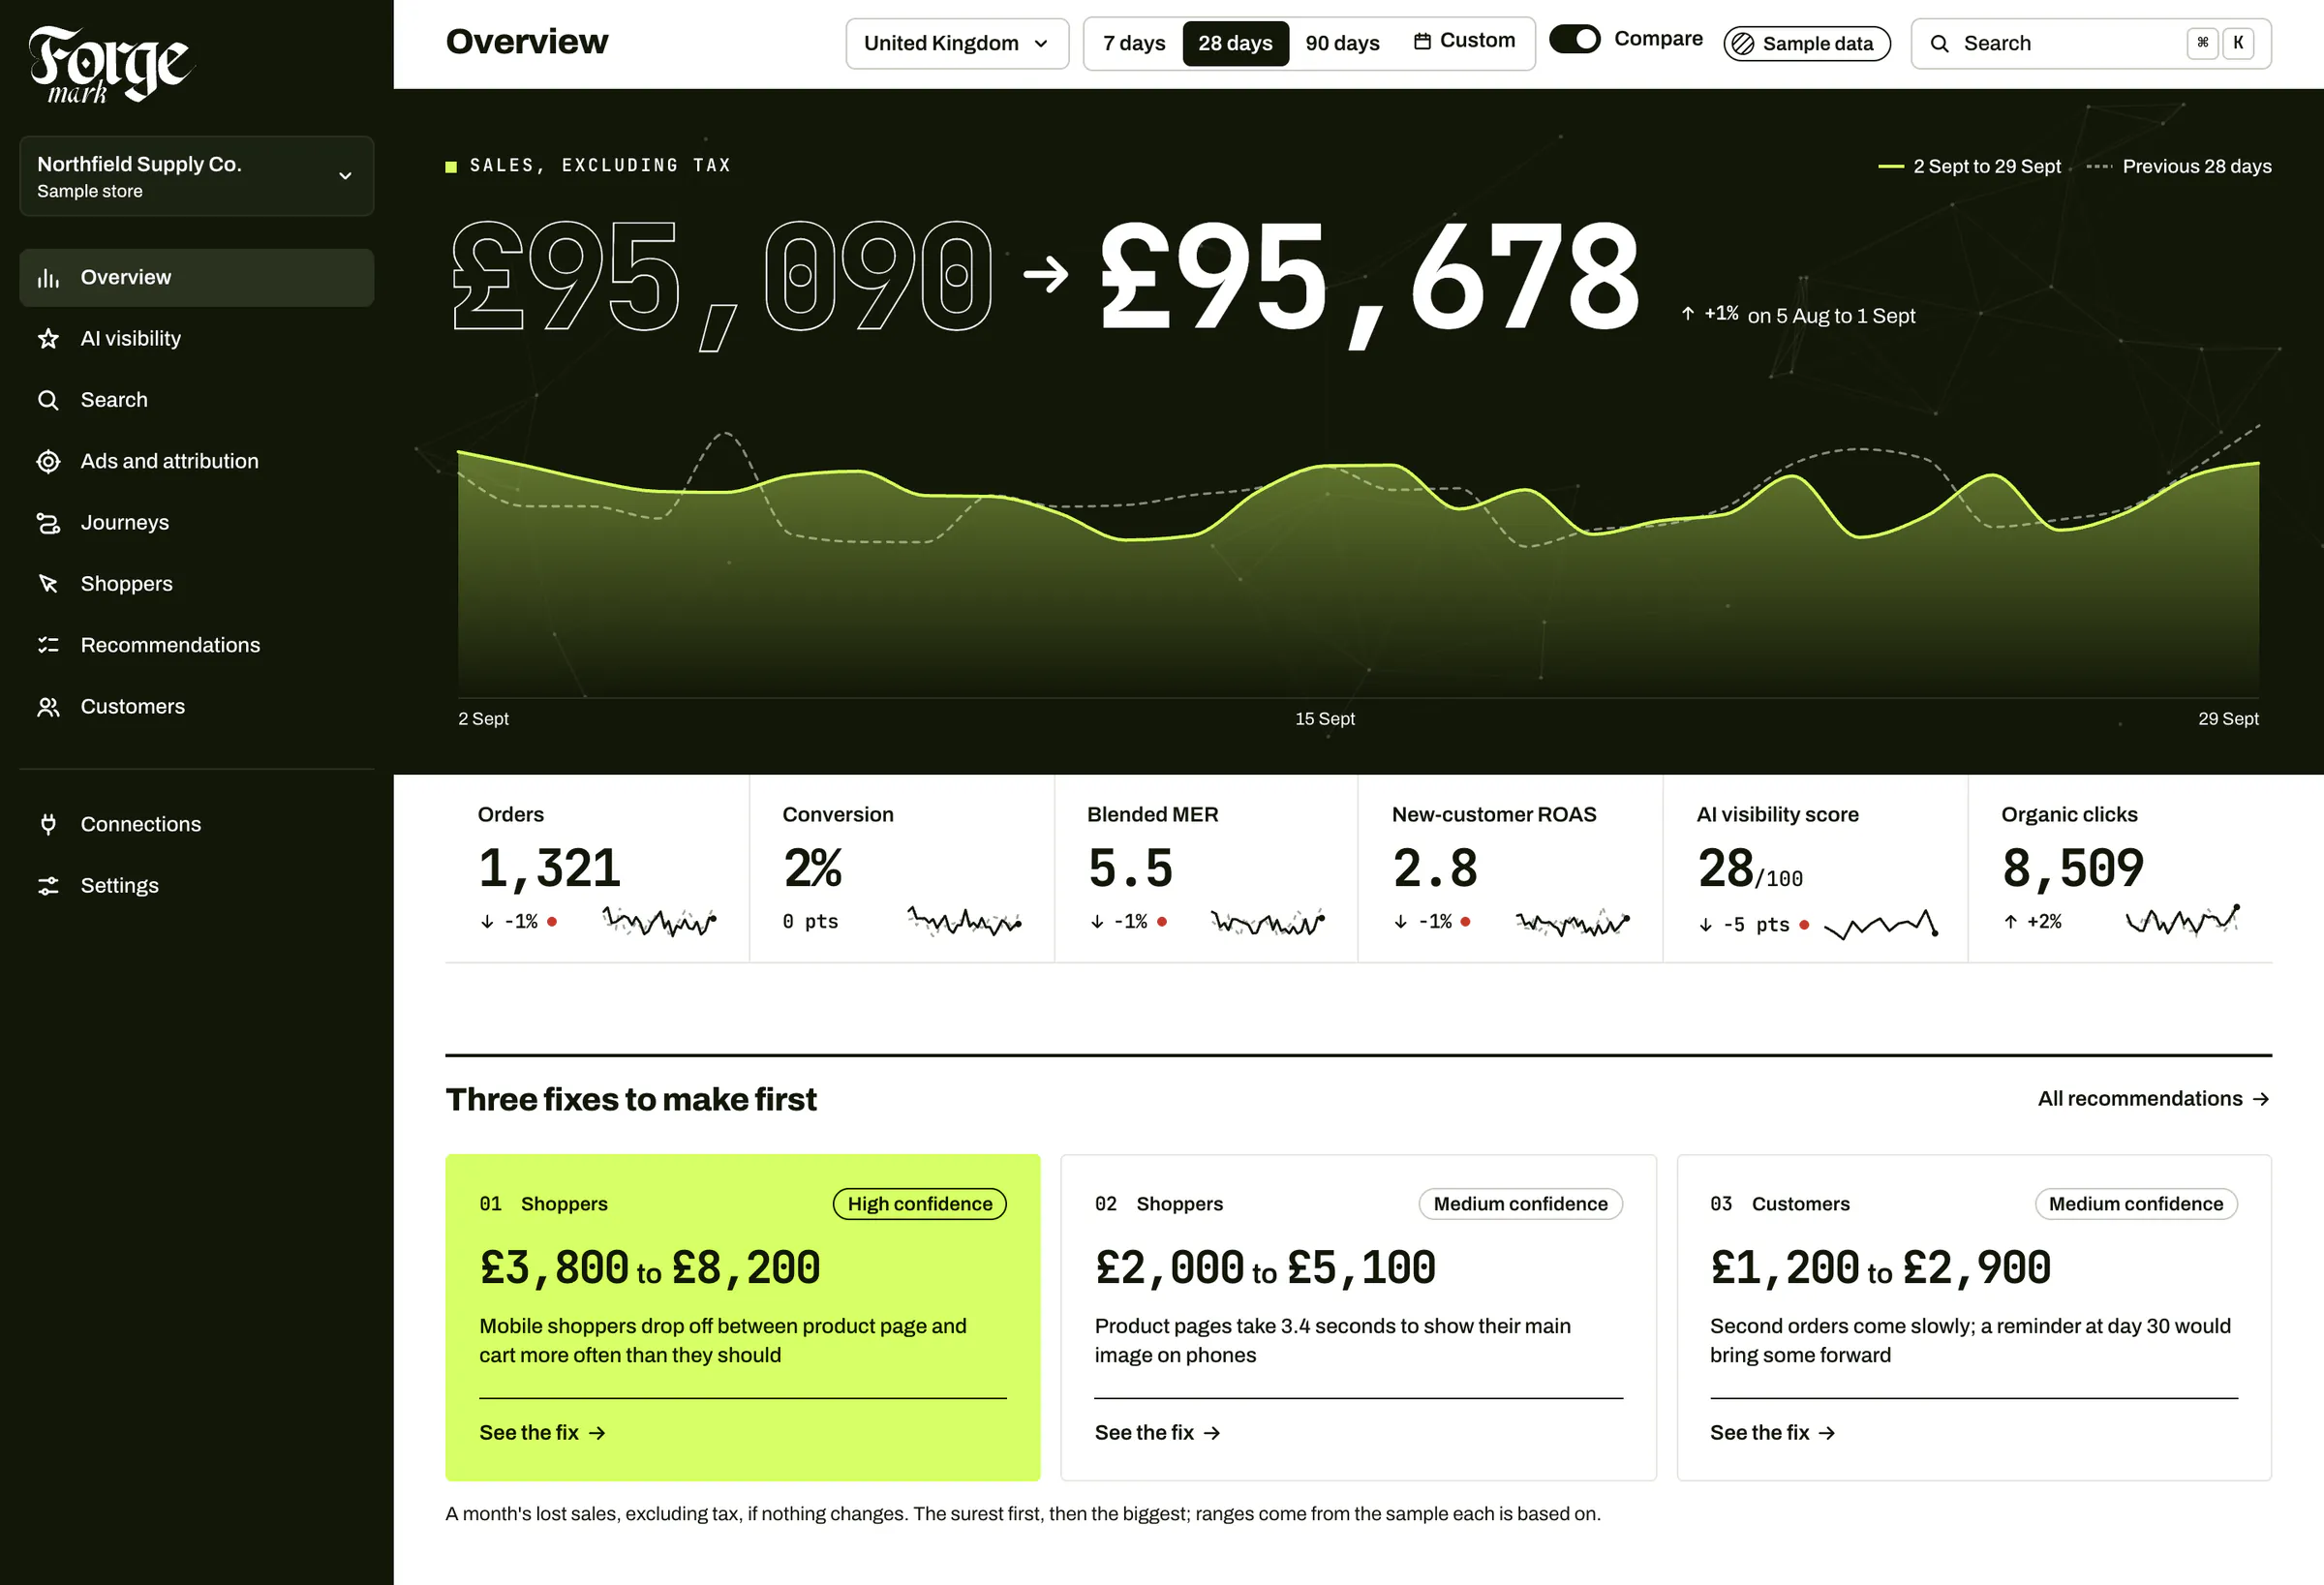
Sales, profit and where they came from, against the period before. Then a ranked list of what to do next, with the money each fix is worth.
Today's sales, orders and return on ad spend, hour by hour, beside the same time yesterday.
Is the week going well, and why
Sales, orders, profit and their sources, Today by default.
Switch to week, month, quarter or year to date, and compare with the period before. MER, blended ROAS and net profit sit at the top.
For UK and EU stores, sales are net of VAT by default.
See it workingLast 28 days
Gross profit£59,400
POAS3.32
Every order in the last 28 days, every cost and all ad spend

Where the money came from
Each source credited five ways, beside what each platform claims.
Open attribution, journeys or measurement when a number surprises you. Visits and sales from AI assistants show as their own channel.
Connect once and it fills in: your store, Google, your ad accounts and Klaviyo, read only.
Explore attributionEvery visit shares the credit equally.
Instagram ad
Day 1

Google ad click
Day 3
Day 5

ChatGPT link
Day 6
Order placed
Day 7, direct visit
What each platform says it earned
- £84.00
- £84.00
- £84.00
£252.00 claimed for a £84.00 sale
What to do about it, surest first
One ranked list, each fix with a range and the evidence.
Open a fix to see what's behind it before you decide. Apply it in the app, brief your developer, or send it to Forge as a costed job.
After it ships, Impact tells you whether it worked.
Explore impactRecommendationsNorthfield Supply Co., surest first
£8,700 to £21,000 a month across eight fixes
-
- 38%
- leave at the delivery step
- 1,240
- checkouts in 28 days
-
- 4.1 s
- to show a product page on a phone
- 1.2%
- of phone visits buy, 2.9% on desktop
-
- £2,140
- spent in 28 days
- 0
- new customers from them
-
- +£4,100
- most likely, a month
- 26
- weeks of spend and sales read
-
- 2,900
- searches a month
- +410
- visits a month at 3rd
-
- 0 of 5
- assistants name you
- 3
- rivals named instead
-
- 22%
- buy again by day 90
- £68
- average second order
-
- 312
- rage taps on ‘Size’
- 18
- product pages
- 1
- screen for sales, profit and sources
- 5
- attribution models beside each platform's claim
- 28
- days until each change you ship has a verdict
- £0
- a month
Frequently asked questions
Do I need to understand attribution?
No. The first screen is sales, profit and the ranked fixes. The attribution models are there when you want to dig.
How do I know the fixes are worth it?
Each shows a range, not a promise. After you ship one, Impact compares the 28 days before and after against the rest of your store.
How long does set-up take?
A few minutes. Install the Shopify app or paste one line of code, then connect Google and your ad accounts with your own logins.
What does it cost?
Nothing for the analytics. If you want a fix done for you, Forge quotes for it separately. See pricing.

Get your Monday screen.
Connect your store in a few minutes and see this week's numbers.